Random or Predictable:
How can “Random” Dice Rolls be Beaten?
Keith Rivadeneira
03/11/2024
Abstract:
In this experiment, I used a random number generator to simulate rolling two dice 100 times in order to prove that dice rolls can be predicted to have a 22% chance of landing a 6. After gathering the data, I then use scholarly research along with my own results in order to prove my hypothesis of how predicting dice rolls can be used in real applications such as playing card games with friends in order to gain an advantage over them.
Introduction
When playing card games with a group of friends (such as poker) it can feel like you’re a victim of fate, but what if you could predict what you’re going to get in order to gain an advantage over your friends? Well this can be done with multiple dice, some quick math, and probability. I believe that after rolling two dice, six will be the most common sum; this is because six is the sum with the most combinations to be made. This is due to there being 11 possible sums between the two dice and six is the only number from 2-12 with three possible combinations. Using a random number generator, we’re able to simulate two dice and are able to roll it 100 times in order to achieve our data.
Materials
- Computer
Methods
- Open up your computer and load up the web browser of your choice.
- Go to https://rolladie.net and select two dice and type in 100 in the “Roll x Times” box.
- Plug in all your data into a spreadsheet.
- Add up each of the sets to get the sums with the command “=SUMS (X:Y)”; where X and Y are column and row.
- Get how often each sum appears in your findings with the command “=COUNTIF (X:Y, A)”; where X and Y are column and row, and A is any number 2-12 being the available sums.
Results

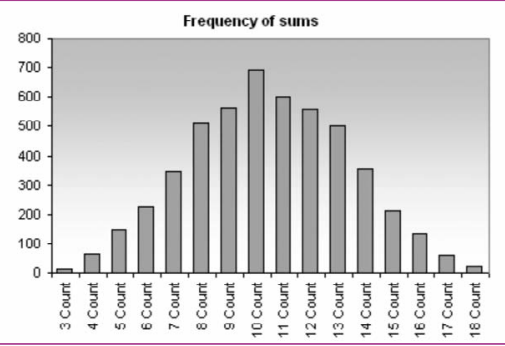
Figure 1.1- This Bar Graph showcases all the sums in how often they appear.

Figure 2.1- This Scatter Chart shows the displacement of the sums.
Analysis
Comparing the results to my original hypothesis, it turns out that my original hypothesis of six being the most common sum is correct. Like I stated earlier, it’s most likely due to six being one of the only sums with three combinations. The next closest sums were seven and nine. Seven being the second most repeated sum isn’t very shocking as although it only has two combinations, its combinations are extremely similar to six. On the other hand, nine being the third most common sum was extremely shocking to me. I was expecting for five to be in the top three most common sums for the same reasons that seven is. The original graph I had in mind was a bell curve, where the numbers increase the closer it is to six, which is correct with nine being an outlier.
Comparing our results to those of Stanislav Lukac and Radovan Engel of the Pavol Jozef Safarik University in Slovakia, we see a similar trend with rolling multiple dice at once. Although in this study, three dice are used rather than two, we still see that trend with the most common sum being the one with the most combinations; just as six was the most common sum in my experiment. “The second problem is closely related to the dice game called Craps. Rolls of two dice and different values of the scores on the dice are the basis of this game. Considering the fact that the probability of the individual dice roll outcomes is the same, it might seem that individual sums of the scores are also equally probable. Even the mathematician Gottfried Wilhelm Leibniz wrongly supposed that the sum of 11 is as probable as the sum of 12. However, practical experience differs. Students should decide which sum, 9 or 10, occurs more frequently when rolling the three dice.” (Lukac Engel 2010 pg. 33) [See appendix for graph of this experiment] This trend of having the number with the most combinations being the most common sum being rolled can help us gain an advantage in playing games with multiple dice. With both my experiment and that of Lukac and Engel’s, we see that this rule is consistent with an increasing amount of dice, offering a rule of thumb for guessing the sum of dice.
Conclusion
After comparing my hypothesis with the results that we were able to gather, I’m able to say that I was correct about six being the most common sum. After using a scholarly source in addition, we were also able to determine that there’s a rule for rolling multiple dice at once, with the number with the most number of combinations being the most common sum. These findings can be used to help achieve a greater advantage in playing games such as Craps or Poker by offering a strategy instead of blind luck. However, I believe there are some aspects of the experiment that could be improved upon, such as rolling the two dice more than 100 times in order to get a more accurate graph. Another aspect of the experiment that could be improved is to introduce more dice. For example, we could start with 2 then after 200 rolls, increase to 3 dice, and keep going until we’re satisfied with the amount of dice we’re rolling.
Work Cited Page
- Lukas S. & Engel R. (2010). Investigation of probability distribution using dice rolling simulation on pages. 33-34.
Appendix
Figure 1.1:

Figure 2.1:

Results from Scholarly Source (Lukac & Engel 2010 pg 35)
Full Results
| Dice One | Dice 2 | Total |
| 3 | 5 | 8 |
| 6 | 2 | 8 |
| 5 | 4 | 9 |
| 1 | 5 | 6 |
| 6 | 3 | 9 |
| 2 | 5 | 7 |
| 3 | 1 | 4 |
| 3 | 3 | 6 |
| 6 | 4 | 10 |
| 3 | 1 | 4 |
| 1 | 6 | 7 |
| 1 | 1 | 2 |
| 6 | 1 | 7 |
| 1 | 3 | 4 |
| 4 | 3 | 7 |
| 5 | 3 | 8 |
| 2 | 5 | 7 |
| 2 | 5 | 7 |
| 6 | 6 | 12 |
| 6 | 4 | 10 |
| 2 | 6 | 8 |
| 2 | 2 | 4 |
| 6 | 3 | 9 |
| 3 | 3 | 6 |
| 1 | 3 | 4 |
| 5 | 2 | 7 |
| 4 | 1 | 5 |
| 6 | 5 | 11 |
| 5 | 5 | 10 |
| 4 | 2 | 6 |
| 5 | 1 | 6 |
| 3 | 3 | 6 |
| 4 | 2 | 6 |
| 5 | 2 | 7 |
| 4 | 1 | 5 |
| 2 | 2 | 4 |
| 1 | 1 | 2 |
| 1 | 1 | 2 |
| 3 | 6 | 9 |
| 1 | 5 | 6 |
| 2 | 4 | 6 |
| 5 | 4 | 9 |
| 5 | 4 | 9 |
| 6 | 1 | 7 |
| 5 | 5 | 10 |
| 3 | 3 | 6 |
| 5 | 4 | 9 |
| 6 | 3 | 9 |
| 1 | 5 | 6 |
| 4 | 1 | 5 |
| 6 | 6 | 12 |
| 4 | 6 | 10 |
| 2 | 4 | 6 |
| 6 | 3 | 9 |
| 2 | 3 | 5 |
| 5 | 1 | 6 |
| 2 | 4 | 6 |
| 2 | 2 | 4 |
| 4 | 1 | 5 |
| 4 | 2 | 6 |
| 6 | 1 | 7 |
| 2 | 1 | 3 |
| 2 | 3 | 5 |
| 3 | 4 | 7 |
| 5 | 2 | 7 |
| 2 | 1 | 3 |
| 2 | 4 | 6 |
| 3 | 6 | 9 |
| 2 | 6 | 8 |
| 1 | 6 | 7 |
| 4 | 5 | 9 |
| 5 | 2 | 7 |
| 3 | 4 | 7 |
| 6 | 4 | 10 |
| 3 | 6 | 9 |
| 5 | 2 | 7 |
| 4 | 6 | 10 |
| 2 | 2 | 4 |
| 1 | 1 | 2 |
| 1 | 5 | 6 |
| 5 | 4 | 9 |
| 3 | 5 | 8 |
| 5 | 2 | 7 |
| 5 | 2 | 7 |
| 2 | 2 | 4 |
| 3 | 5 | 8 |
| 1 | 5 | 6 |
| 5 | 3 | 8 |
| 3 | 2 | 5 |
| 2 | 3 | 5 |
| 2 | 1 | 3 |
| 4 | 2 | 6 |
| 4 | 1 | 5 |
| 3 | 2 | 5 |
| 1 | 5 | 6 |
| 5 | 1 | 6 |
| 4 | 2 | 6 |
| 3 | 6 | 9 |
| 3 | 5 | 8 |
| 6 | 6 | 12 |

This entry is licensed under a Creative Commons Attribution-NonCommercial-ShareAlike 4.0 International license.